Beware
Failing to set a dataset key will result in a
Phpopenchart\Exception\DatasetNotDefinedException
exception.
This is a highly configurable PHP library that enables you to produce chart-like images.
You simply create a new object of the chart class, set the dimensions and the chart dataset (and all the other available configurations, if needed) and a chart image is created. You can then display the image on the page or store it on a file.
Behind the curtain, the library calculates the dimensions of all the components (graph, axis, title, labels, columns / bars, lines / pie slices, etc..) and assembles the final image.
To use this package on your project, you need to use Composer .
Once you have Composer, just add the package as a dependency, as follows:
"require": {
    "luismarto/phpopenchart": "3.*"
}To create a chart you need to use one of the following classes, based on the chart you want to produce. The class names are fairly expressive.
<?php
use Phpopenchart\Chart\Column;
use Phpopenchart\Chart\Bar;
use Phpopenchart\Chart\Line;
use Phpopenchart\Chart\Pie;
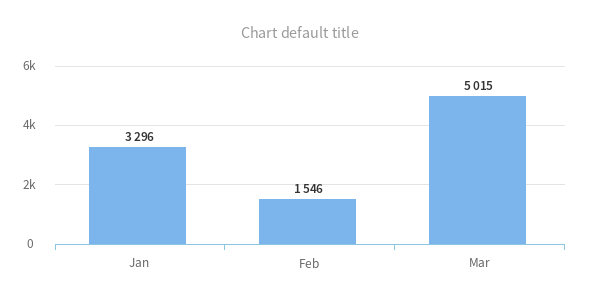
Then, you just need to create the chart with your options and render it, as such, which produces a chart like the image below
<?php
use Phpopenchart\Chart\Column;

$chart = new Column([
    'dataset' => [
        'labels' => ['Jan', 'Feb', 'Mar'],
        'data'   => [3296, 1546, 5015]
    ]
]);
$chart->render();

The dataset parameter is required and represents the information you want to display on the chart. There are two formats for dataset, based on the information you want to display
Failing to set a dataset key will result in a
Phpopenchart\Exception\DatasetNotDefinedException
exception.
If you want to display a single serie, you should set the
'dataset' key to an array of
'labels' and
'data'. Each element in
'data' can be either an integer
(the value) or an array (the value and the color).
Make sure you use the same number of elements both in labels and data.
The format for this type of dataset is as follows.
'dataset' => [
    'labels' => ['Jan', 'Feb', 'Mar'],
    'data' => [
        3296,
        [1546, '#F88C30'],
        5015,
    ]
]
The result of such dataset is similar to the example above.
Whenever you need to display multiple series in the same chart, you need
to use another format for the dataset.
Specifically, you need add a 'series' key,
that must be an array with the series names.
As for the 'data' key, when using multiple
series, you need to set it to an array of arrays.
'dataset' => [
    'series' => ['First series', 'Second Series'],
    'labels' => ['Jan', 'Feb', 'Mar'],
    'data'   => [
        [
            3296, 154, 5015
        ],
        [
            [564, '#cccccc'], 1564, 3215
        ],
    ]
]
Similar to the single series data points can either be an integer or an array, with the first element as the value and the second as the color.