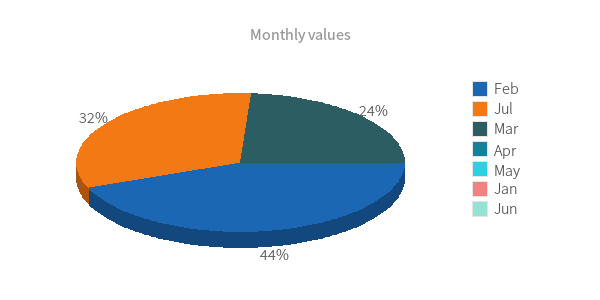
A note for negative values on Pie charts
As you can see in the example below, all values lower than 0 are treated as 0 and are not taken into account when the chart is processed. That's why there's only three pie slices on the chart.

<?php
include "../vendor/autoload.php";

use Phpopenchart\Chart\Column;

(new Column([
    'title'  => [
		'text' => 'Monthly values',
	],
	'dataset' => [
		'labels' => ['Jan', 'Feb', 'Mar', 'Apr', 'May', 'Jun', 'Jul'],
		'data'   => [3296, 1564, 256, 4578, 2164, 3658, 1145]
	]
]))->render();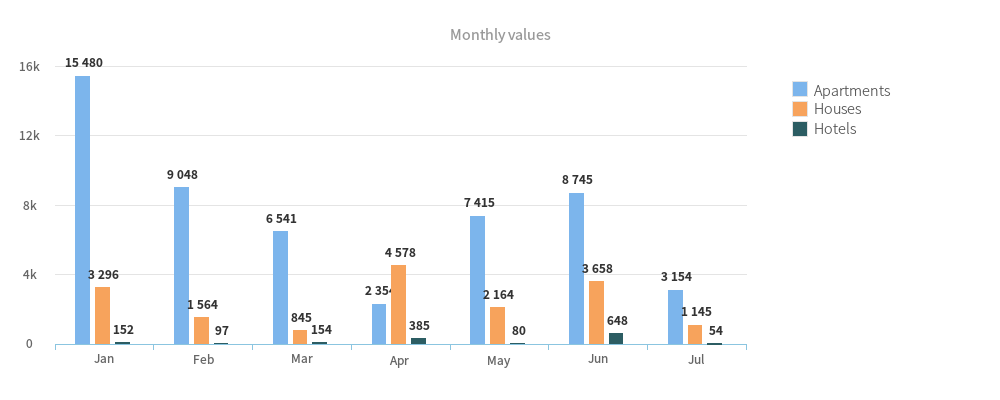
<?php
include "../vendor/autoload.php";

use Phpopenchart\Chart\Column;

(new Column([
	'chart' => [
		'width'  => 1000,
		'height' => 400
	],
	'title'  => [
		'text' => 'Monthly values',
	],
	'dataset' => [
		'series' => ['Apartments', 'Houses', 'Hotels'],
		'labels' => ['Jan', 'Feb', 'Mar', 'Apr', 'May', 'Jun', 'Jul'],
		'data'   => [
			[15480, 9048, 6541, 2354, 7415, 8745, 3154],
			[3296, 1564, 845, 4578, 2164, 3658, 1145],
			[152, 97, 154, 385, 80, 648, 54],
		],
	]
]))->render();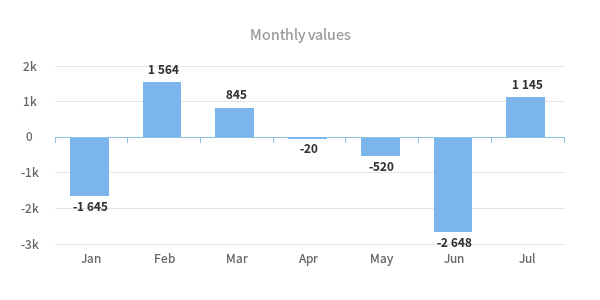
<?php
include "../vendor/autoload.php";

use Phpopenchart\Chart\Column;

(new Column([
	'title'  => [
		'text' => 'Monthly values',
	],
	'dataset' => [
		'labels' => ['Jan', 'Feb', 'Mar', 'Apr', 'May', 'Jun', 'Jul'],
		'data'   => [-1645, 1564, 845, -20, -520, -2648, 1145],
	]
]))->render();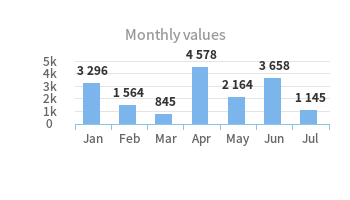
<?php
include "../vendor/autoload.php";

use Phpopenchart\Chart\Column;

(new Column([
	'chart' => [
		'width'          => 350,
		'height'         => 200,
		'column-padding' => [0, 15, 70, 70],
	],
	'title'  => [
		'text' => 'Monthly values',
	],
	'dataset' => [
		'labels' => ['Jan', 'Feb', 'Mar', 'Apr', 'May', 'Jun', 'Jul'],
		'data'   => [3296, 1564, 845, 4578, 2164, 3658, 1145],
	]
]))->render();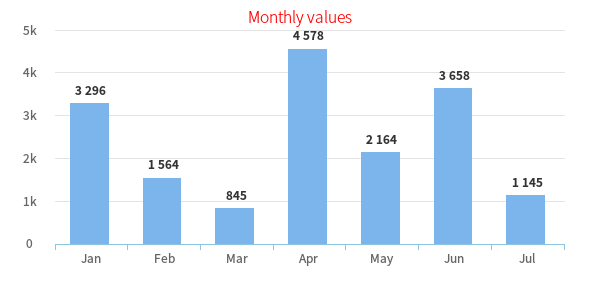
<?php
include "../vendor/autoload.php";

use Phpopenchart\Chart\Column;

(new Column([
	'title'  => [
		'text'   => 'Monthly values',
		'font'   => 'SourceSansPro-Light.otf',
		'size'   => 13,
		'color'  => '#FF0000',
		'height' => 20,
		'padding' => [0]
	],
	'dataset' => [
		'labels' => ['Jan', 'Feb', 'Mar', 'Apr', 'May', 'Jun', 'Jul'],
		'data'   => [3296, 1564, 845, 4578, 2164, 3658, 1145],
	]
]))->render();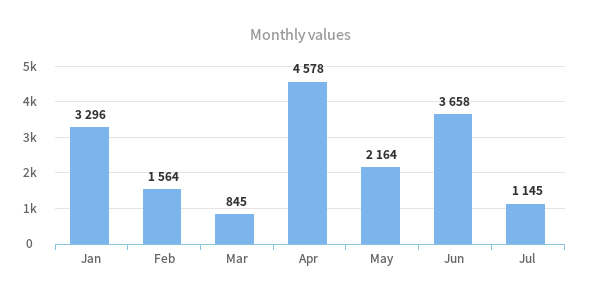
<?php
include "../vendor/autoload.php";

use Phpopenchart\Chart\Column;

(new Column([
	'title'  => [
		'text' => 'Monthly values',
	],
	'label-axis'  => [
		'font'   => 'SourceSansPro-Light.otf',
		'size'   => 12,
		'color'  => '#FF0000',
		'angle'  => 35,
		'margin' => [
			'top'  => 15,
			'left' => 20
		],
		'generator' => '\Phpopenchart\Label\DefaultLabel',
	],
	'dataset' => [
		'labels' => ['Jan', 'Feb', 'Mar', 'Apr', 'May', 'Jun', 'Jul'],
		'data'   => [3296, 1564, 845, 4578, 2164, 3658, 1145],
	]
]))->render();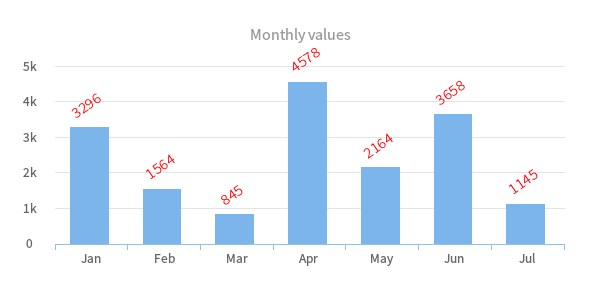
<?php
include "../vendor/autoload.php";

use Phpopenchart\Chart\Column;

(new Column([
	'title'  => [
		'text' => 'Monthly values',
	],
	'point-label'  => [
		'font'   => 'SourceSansPro-Light.otf',
		'size'   => 12,
		'color'  => '#FF0000',
		'angle'  => 35,
		'generator' => '\Phpopenchart\Label\DefaultLabel',
	],
	'dataset' => [
		'labels' => ['Jan', 'Feb', 'Mar', 'Apr', 'May', 'Jun', 'Jul'],
		'data'   => [3296, 1564, 845, 4578, 2164, 3658, 1145],
	]
]))->render();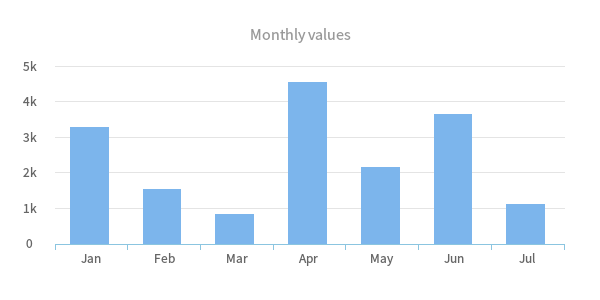
<?php
include "../vendor/autoload.php";

use Phpopenchart\Chart\Column;

(new Column([
	'title'  => [
		'text' => 'Monthly values',
	],
	'point-label'  => [
		'show'   => false
	],
	'dataset' => [
		'labels' => ['Jan', 'Feb', 'Mar', 'Apr', 'May', 'Jun', 'Jul'],
		'data'   => [3296, 1564, 845, 4578, 2164, 3658, 1145],
	]
]))->render();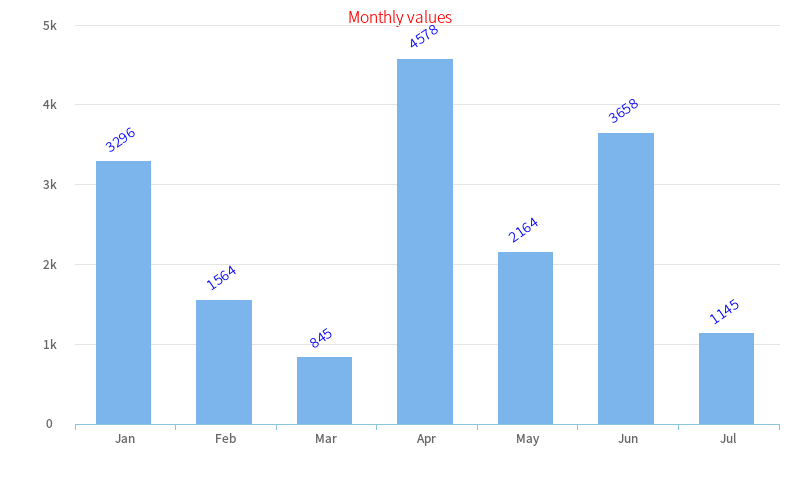
<?php
include "../vendor/autoload.php";

use Phpopenchart\Chart\Column;

(new Column([
	'chart' => [
		'width'          => 800,
		'height'         => 500,
		'column-padding' => [0, 15, 70, 70],
	],
	'title'  => [
		'text'   => 'Monthly values',
		'font'   => 'SourceSansPro-Light.otf',
		'size'   => 13,
		'color'  => '#FF0000',
		'height' => 20,
		'padding' => [0]
	],
	'label-axis'  => [
		'font'   => 'SourceSansPro-Light.otf',
		'size'   => 12,
		'color'  => '#00FF00',
		'angle'  => -35,
		'margin' => [
			'top'  => 15,
			'left' => 20
		],
		'generator' => '\Phpopenchart\Label\DefaultLabel',
	],
	'point-label'  => [
		'font'   => 'SourceSansPro-Light.otf',
		'size'   => 12,
		'color'  => '#0000FF',
		'angle'  => 35,
		'generator' => '\Phpopenchart\Label\DefaultLabel',
	],
	'dataset' => [
		'labels' => ['Jan', 'Feb', 'Mar', 'Apr', 'May', 'Jun', 'Jul'],
		'data'   => [3296, 1564, 845, 4578, 2164, 3658, 1145],
	]
]))->render();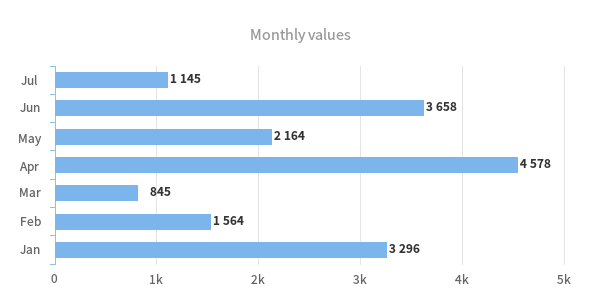
<?php
include "../vendor/autoload.php";

use Phpopenchart\Chart\Bar;

(new Bar([
    'title'  => [
		'text' => 'Monthly values',
	],
	'dataset' => [
		'labels' => ['Jan', 'Feb', 'Mar', 'Apr', 'May', 'Jun', 'Jul'],
		'data'   => [3296, 1564, 256, 4578, 2164, 3658, 1145]
	]
]))->render();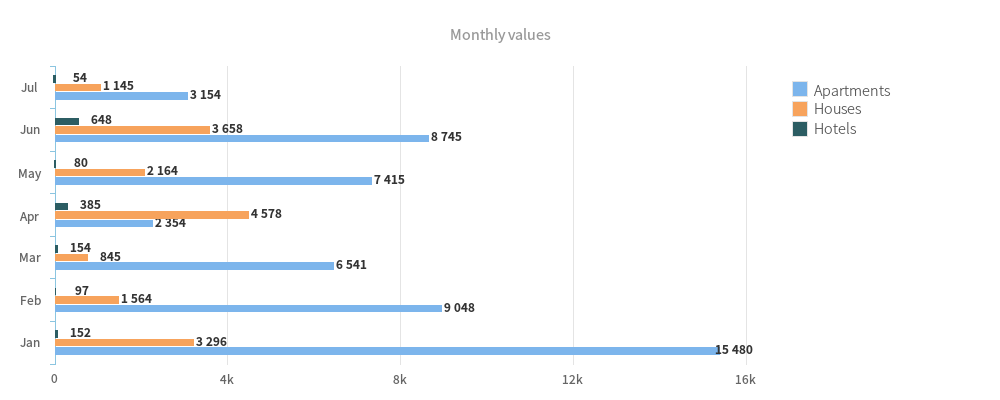
<?php
include "../vendor/autoload.php";

use Phpopenchart\Chart\Bar;

(new Bar([
	'chart' => [
		'width'  => 1000,
		'height' => 400
	],
	'title'  => [
		'text' => 'Monthly values',
	],
	'dataset' => [
		'series' => ['Apartments', 'Houses', 'Hotels'],
		'labels' => ['Jan', 'Feb', 'Mar', 'Apr', 'May', 'Jun', 'Jul'],
		'data'   => [
			[15480, 9048, 6541, 2354, 7415, 8745, 3154],
			[3296, 1564, 845, 4578, 2164, 3658, 1145],
			[152, 97, 154, 385, 80, 648, 54],
		],
	]
]))->render();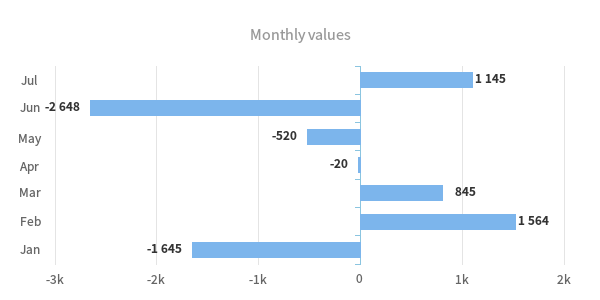
<?php
include "../vendor/autoload.php";

use Phpopenchart\Chart\Bar;

(new Bar([
	'title'  => [
		'text' => 'Monthly values',
	],
	'dataset' => [
		'labels' => ['Jan', 'Feb', 'Mar', 'Apr', 'May', 'Jun', 'Jul'],
		'data'   => [-1645, 1564, 845, -20, -520, -2648, 1145],
	]
]))->render();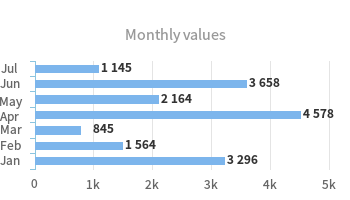
<?php
include "../vendor/autoload.php";

use Phpopenchart\Chart\Bar;

(new Bar([
	'chart' => [
		'width'       => 350,
		'height'      => 200,
		'bar-padding' => [0, 15, 25, 30],
	],
	'title'  => [
		'text' => 'Monthly values',
	],
	'dataset' => [
		'labels' => ['Jan', 'Feb', 'Mar', 'Apr', 'May', 'Jun', 'Jul'],
		'data'   => [3296, 1564, 845, 4578, 2164, 3658, 1145],
	]
]))->render();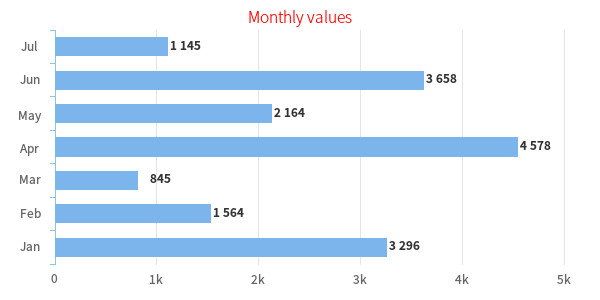
<?php
include "../vendor/autoload.php";

use Phpopenchart\Chart\Bar;

(new Bar([
	'title'  => [
		'text'    => 'Monthly values',
		'font'    => 'SourceSansPro-Light.otf',
		'size'    => 13,
		'color'   => '#FF0000',
		'height'  => 20,
		'padding' => [0]
	],
	'dataset' => [
		'labels' => ['Jan', 'Feb', 'Mar', 'Apr', 'May', 'Jun', 'Jul'],
		'data'   => [3296, 1564, 845, 4578, 2164, 3658, 1145],
	]
]))->render();
<?php
include "../vendor/autoload.php";

use Phpopenchart\Chart\Bar;

(new Bar([
	'title'  => [
		'text' => 'Monthly values',
	],
	'label-axis'  => [
		'font'   => 'SourceSansPro-Light.otf',
		'size'   => 12,
		'color'  => '#FF0000',
		'angle'  => 35,
		'margin' => [
			'top'  => 15,
			'left' => 20
		],
		'generator' => '\Phpopenchart\Label\DefaultLabel',
	],
	'dataset' => [
		'labels' => ['Jan', 'Feb', 'Mar', 'Apr', 'May', 'Jun', 'Jul'],
		'data'   => [3296, 1564, 845, 4578, 2164, 3658, 1145],
	]
]))->render();
<?php
include "../vendor/autoload.php";

use Phpopenchart\Chart\Bar;

(new Bar([
	'title'  => [
		'text' => 'Monthly values',
	],
	'point-label'  => [
		'font'   	=> 'SourceSansPro-Light.otf',
		'size'  	=> 12,
		'color' 	=> '#FF0000',
		'angle'  	=> 35,
		'generator' => '\Phpopenchart\Label\DefaultLabel',
	],
	'dataset' => [
		'labels' => ['Jan', 'Feb', 'Mar', 'Apr', 'May', 'Jun', 'Jul'],
		'data'   => [3296, 1564, 845, 4578, 2164, 3658, 1145],
	]
]))->render();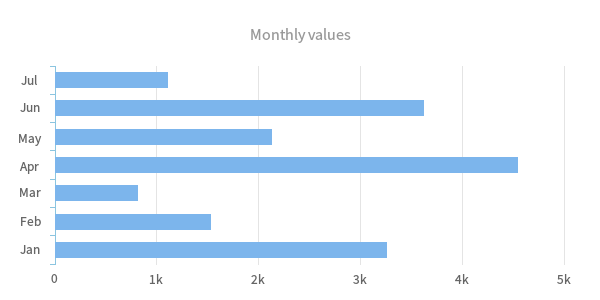
<?php
include "../vendor/autoload.php";

use Phpopenchart\Chart\Bar;

(new Bar([
	'title'  => [
		'text' => 'Monthly values',
	],
	'point-label'  => [
		'show'   => false
	],
	'dataset' => [
		'labels' => ['Jan', 'Feb', 'Mar', 'Apr', 'May', 'Jun', 'Jul'],
		'data'   => [3296, 1564, 845, 4578, 2164, 3658, 1145],
	]
]))->render();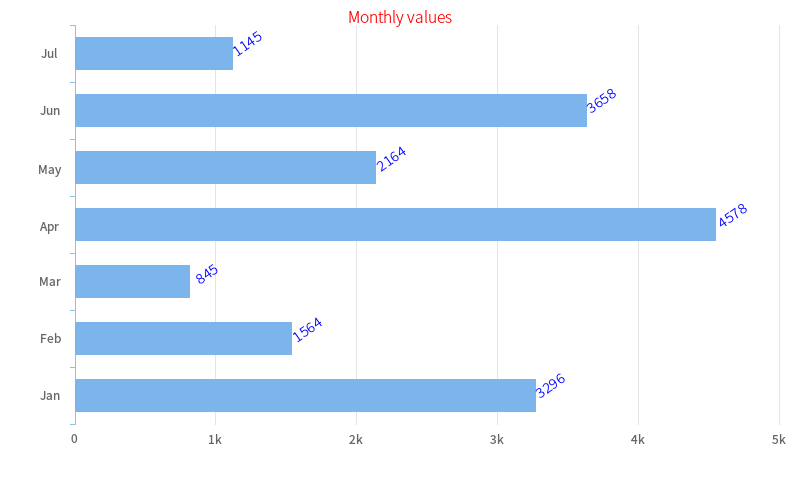
<?php
include "../vendor/autoload.php";

use Phpopenchart\Chart\Bar;

(new Bar([
	'chart' => [
		'width'       => 800,
		'height'      => 500,
		'bar-padding' => [0, 15, 70, 70],
	],
	'title'  => [
		'text'   => 'Monthly values',
		'font'   => 'SourceSansPro-Light.otf',
		'size'   => 13,
		'color'  => '#FF0000',
		'height' => 20,
		'padding' => [0]
	],
	'label-axis'  => [
		'font'   => 'SourceSansPro-Light.otf',
		'size'   => 12,
		'color'  => '#00FF00',
		'angle'  => -35,
		'margin' => [
			'top'  => 15,
			'left' => 20
		],
		'generator' => '\Phpopenchart\Label\DefaultLabel',
	],
	'point-label'  => [
		'font'  	=> 'SourceSansPro-Light.otf',
		'size'  	=> 12,
		'color' 	=> '#0000FF',
		'angle'  	=> 35,
		'generator' => '\Phpopenchart\Label\DefaultLabel',
	],
	'dataset' => [
		'labels' => ['Jan', 'Feb', 'Mar', 'Apr', 'May', 'Jun', 'Jul'],
		'data'   => [3296, 1564, 845, 4578, 2164, 3658, 1145],
	]
]))->render();
<?php
include "../vendor/autoload.php";

use Phpopenchart\Chart\Line;

(new Line([
    'title'  => [
		'text' => 'Monthly values',
	],
	'dataset' => [
		'labels' => ['Jan', 'Feb', 'Mar', 'Apr', 'May', 'Jun', 'Jul'],
		'data'   => [3296, 1564, 256, 4578, 2164, 3658, 1145]
	]
]))->render();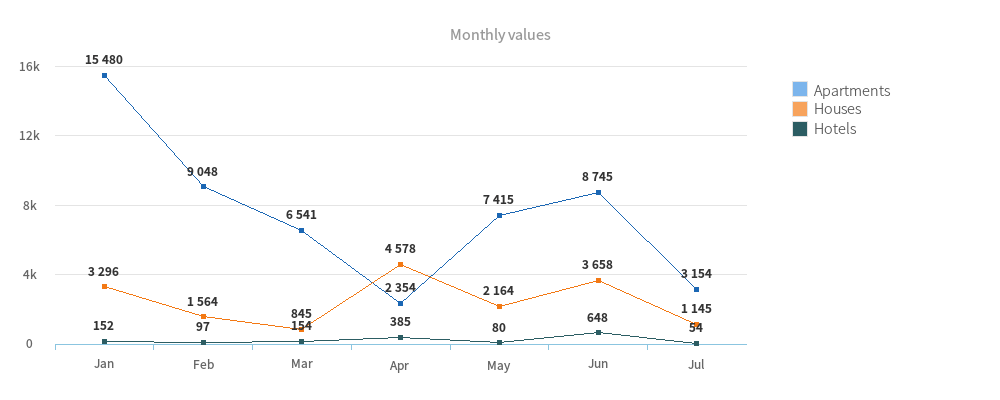
<?php
include "../vendor/autoload.php";

use Phpopenchart\Chart\Line;

(new Line([
	'chart' => [
		'width'  => 1000,
		'height' => 400
	],
	'title'  => [
		'text' => 'Monthly values',
	],
	'dataset' => [
		'series' => ['Apartments', 'Houses', 'Hotels'],
		'labels' => ['Jan', 'Feb', 'Mar', 'Apr', 'May', 'Jun', 'Jul'],
		'data'   => [
			[15480, 9048, 6541, 2354, 7415, 8745, 3154],
			[3296, 1564, 845, 4578, 2164, 3658, 1145],
			[152, 97, 154, 385, 80, 648, 54],
		],
	]
]))->render();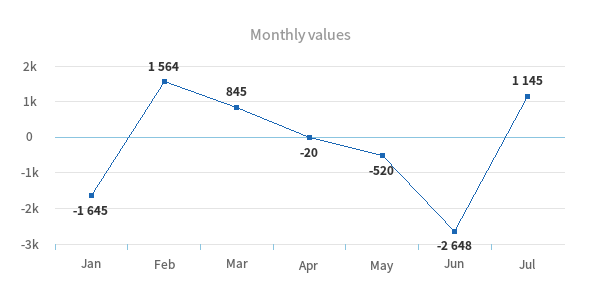
<?php
include "../vendor/autoload.php";

use Phpopenchart\Chart\Line;

(new Line([
	'title'  => [
		'text' => 'Monthly values',
	],
	'dataset' => [
		'labels' => ['Jan', 'Feb', 'Mar', 'Apr', 'May', 'Jun', 'Jul'],
		'data'   => [-1645, 1564, 845, -20, -520, -2648, 1145],
	]
]))->render();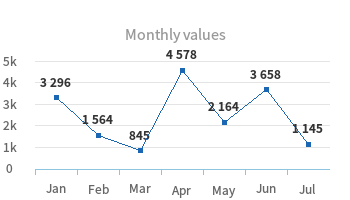
<?php
include "../vendor/autoload.php";

use Phpopenchart\Chart\Line;

(new Line([
	'chart' => [
		'width'       => 350,
		'height'      => 200,
		'line-padding' => [0, 15, 25, 30],
	],
	'title'  => [
		'text' => 'Monthly values',
	],
	'dataset' => [
		'labels' => ['Jan', 'Feb', 'Mar', 'Apr', 'May', 'Jun', 'Jul'],
		'data'   => [3296, 1564, 845, 4578, 2164, 3658, 1145],
	]
]))->render();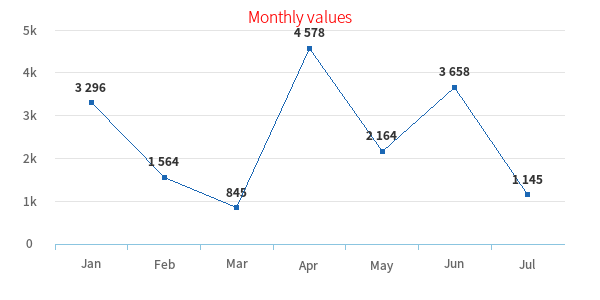
<?php
include "../vendor/autoload.php";

use Phpopenchart\Chart\Line;

(new Line([
	'title'  => [
		'text'    => 'Monthly values',
		'font'    => 'SourceSansPro-Light.otf',
		'size'    => 13,
		'color'   => '#FF0000',
		'height'  => 20,
		'padding' => [0]
	],
	'dataset' => [
		'labels' => ['Jan', 'Feb', 'Mar', 'Apr', 'May', 'Jun', 'Jul'],
		'data'   => [3296, 1564, 845, 4578, 2164, 3658, 1145],
	]
]))->render();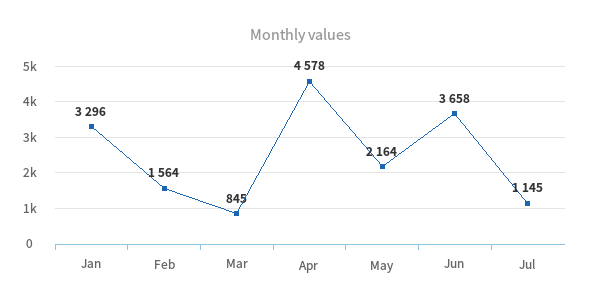
<?php
include "../vendor/autoload.php";

use Phpopenchart\Chart\Line;

(new Line([
	'title'  => [
		'text' => 'Monthly values',
	],
	'label-axis'  => [
		'font'   => 'SourceSansPro-Light.otf',
		'size'   => 12,
		'color'  => '#FF0000',
		'angle'  => 35,
		'margin' => [
			'top'  => 15,
			'left' => 20
		],
		'generator' => '\Phpopenchart\Label\DefaultLabel',
	],
	'dataset' => [
		'labels' => ['Jan', 'Feb', 'Mar', 'Apr', 'May', 'Jun', 'Jul'],
		'data'   => [3296, 1564, 845, 4578, 2164, 3658, 1145],
	]
]))->render();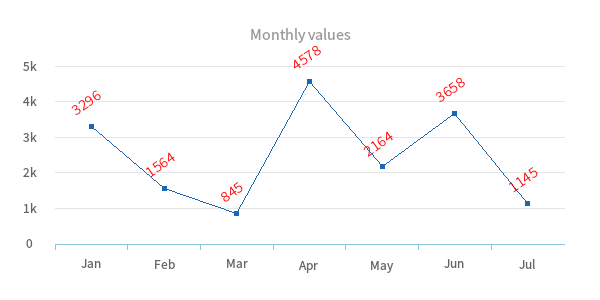
<?php
include "../vendor/autoload.php";

use Phpopenchart\Chart\Line;

(new Line([
	'title'  => [
		'text' => 'Monthly values',
	],
	'point-label'  => [
		'font'   	=> 'SourceSansPro-Light.otf',
		'size'  	=> 12,
		'color' 	=> '#FF0000',
		'angle'  	=> 35,
		'generator' => '\Phpopenchart\Label\DefaultLabel',
	],
	'dataset' => [
		'labels' => ['Jan', 'Feb', 'Mar', 'Apr', 'May', 'Jun', 'Jul'],
		'data'   => [3296, 1564, 845, 4578, 2164, 3658, 1145],
	]
]))->render();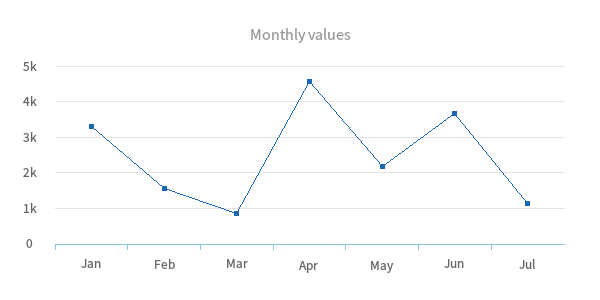
<?php
include "../vendor/autoload.php";

use Phpopenchart\Chart\Line;

(new Line([
	'title'  => [
		'text' => 'Monthly values',
	],
	'point-label'  => [
		'show'   => false
	],
	'dataset' => [
		'labels' => ['Jan', 'Feb', 'Mar', 'Apr', 'May', 'Jun', 'Jul'],
		'data'   => [3296, 1564, 845, 4578, 2164, 3658, 1145],
	]
]))->render();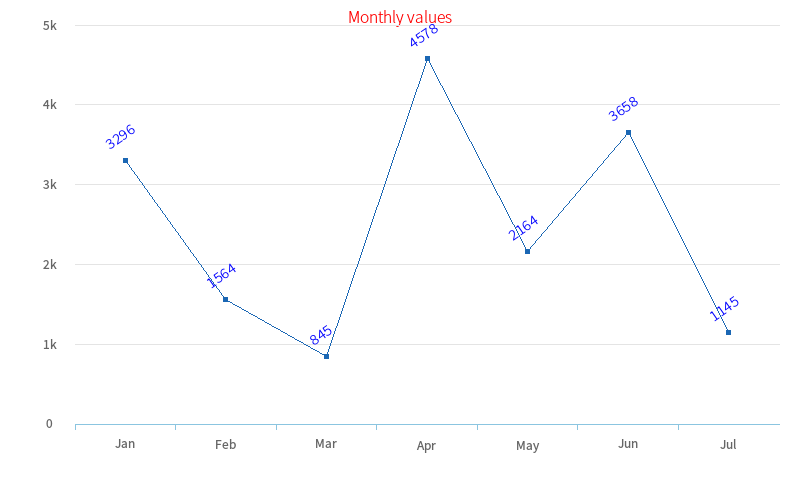
<?php
include "../vendor/autoload.php";

use Phpopenchart\Chart\Line;

(new Line([
	'chart' => [
		'width'       => 800,
		'height'      => 500,
		'line-padding' => [0, 15, 70, 70],
	],
	'title'  => [
		'text'   => 'Monthly values',
		'font'   => 'SourceSansPro-Light.otf',
		'size'   => 13,
		'color'  => '#FF0000',
		'height' => 20,
		'padding' => [0]
	],
	'label-axis'  => [
		'font'   => 'SourceSansPro-Light.otf',
		'size'   => 12,
		'color'  => '#00FF00',
		'angle'  => -35,
		'margin' => [
			'top'  => 15,
			'left' => 20
		],
		'generator' => '\Phpopenchart\Label\DefaultLabel',
	],
	'point-label'  => [
		'font'   => 'SourceSansPro-Light.otf',
		'size'   => 12,
		'color'  => '#0000FF',
		'angle'  => 35,
		'generator' => '\Phpopenchart\Label\DefaultLabel',
	],
	'dataset' => [
		'labels' => ['Jan', 'Feb', 'Mar', 'Apr', 'May', 'Jun', 'Jul'],
		'data'   => [3296, 1564, 845, 4578, 2164, 3658, 1145],
	]
]))->render();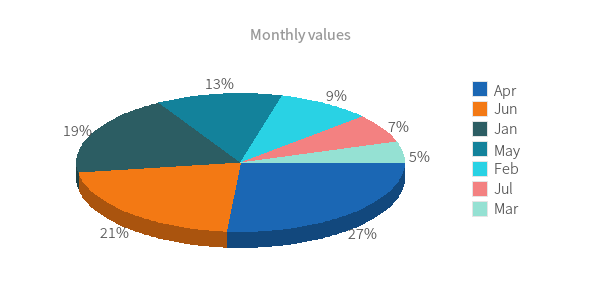
<?php
include "../vendor/autoload.php";

use Phpopenchart\Chart\Pie;

(new Pie([
    'title'  => [
		'text' => 'Monthly values',
	],
	'dataset' => [
		'labels' => ['Jan', 'Feb', 'Mar', 'Apr', 'May', 'Jun', 'Jul'],
		'data'   => [3296, 1564, 256, 4578, 2164, 3658, 1145]
	]
]))->render();As you can see in the example below, all values lower than 0 are treated as 0 and are not taken into account when the chart is processed. That's why there's only three pie slices on the chart.
<?php
include "../vendor/autoload.php";

use Phpopenchart\Chart\Pie;

(new Pie([
	'title'  => [
		'text' => 'Monthly values',
	],
	'dataset' => [
		'labels' => ['Jan', 'Feb', 'Mar', 'Apr', 'May', 'Jun', 'Jul'],
		'data'   => [-1645, 1564, 845, -20, -520, -2648, 1145],
	]
]))->render();
<?php
include "../vendor/autoload.php";

use Phpopenchart\Chart\Pie;

(new Pie([
	'chart' => [
		'width'       => 350,
		'height'      => 200,
		'pie-padding' => [0, 15, 25, 30],
	],
	'title'  => [
		'text' => 'Monthly values',
	],
	'dataset' => [
		'labels' => ['Jan', 'Feb', 'Mar', 'Apr', 'May', 'Jun', 'Jul'],
		'data'   => [3296, 1564, 845, 4578, 2164, 3658, 1145],
	]
]))->render();
<?php
include "../vendor/autoload.php";

use Phpopenchart\Chart\Pie;

(new Pie([
	'title'  => [
		'text'    => 'Monthly values',
		'font'    => 'SourceSansPro-Light.otf',
		'size'    => 13,
		'color'   => '#FF0000',
		'height'  => 20,
		'padding' => [0]
	],
	'dataset' => [
		'labels' => ['Jan', 'Feb', 'Mar', 'Apr', 'May', 'Jun', 'Jul'],
		'data'   => [3296, 1564, 845, 4578, 2164, 3658, 1145],
	]
]))->render();
<?php
include "../vendor/autoload.php";

use Phpopenchart\Chart\Pie;

(new Pie([
	'title'  => [
		'text' => 'Monthly values',
	],
	'point-label'  => [
		'show'   => false
	],
	'dataset' => [
		'labels' => ['Jan', 'Feb', 'Mar', 'Apr', 'May', 'Jun', 'Jul'],
		'data'   => [3296, 1564, 845, 4578, 2164, 3658, 1145],
	]
]))->render();
<?php
include "../vendor/autoload.php";

use Phpopenchart\Chart\Pie;

(new Pie([
	'chart' => [
		'width'       => 800,
		'height'      => 500,
		'pie-padding' => [0, 15, 70, 70],
	],
	'title'  => [
		'text'   => 'Monthly values',
		'font'   => 'SourceSansPro-Light.otf',
		'size'   => 13,
		'color'  => '#FF0000',
		'height' => 20,
		'padding' => [0]
	],
	'dataset' => [
		'labels' => ['Jan', 'Feb', 'Mar', 'Apr', 'May', 'Jun', 'Jul'],
		'data'   => [3296, 1564, 845, 4578, 2164, 3658, 1145],
	]
]))->render();